South African Reserve Bank released their Monetary Policy Decision minutes. Below is the excerpt
“The monetary policy stance remains accommodative and appropriate, with the real policy rate remaining slightly negative, notwithstanding the expected temporary breach of the inflation target. However, further accommodation at this stage is constrained by the upside risks to the inflation outlook. The MPC has therefore decided to keep the repurchase rate unchanged at 5,0 per cent per annum. As always, the MPC will monitor developments closely and will not hesitate to act in a manner consistent with its mandate.”
Overall tone is dovish, and understandably so, with South African economy heading lower with ongoing labor conflict, and a shrinkage of mining sector in line with decreasing global demand. Also, a large part of ZAR’s rally last year was due to huge increase in non-resident purchase of Rand Bonds, which totaled R88.6Billion as a result of their inclusion into Citibank World Government Bond Index – a vote of confidence for investment grade bonds. Currently, Rand Bonds are under threat of downgrades by rating agencies, and there are whispers in the market about them being swiftly removed from the Bond Index should that happens. Though such extreme scenarios are unlikely, confidence is sapping away, resulting in further declines in ZAR.
Weekly Chart
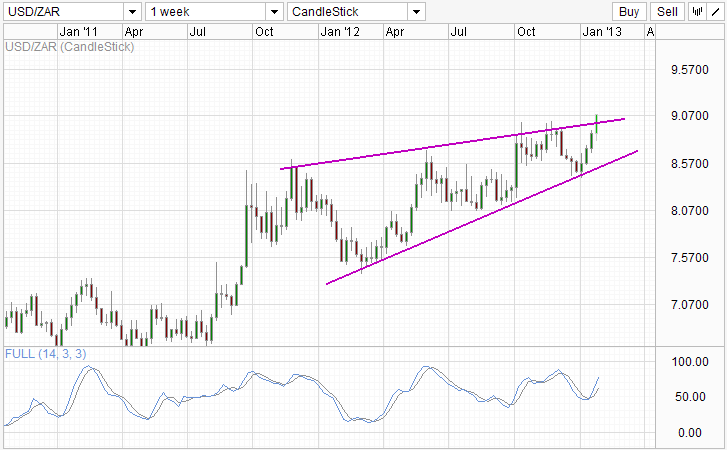
With the recovery of US Economy, and the temporary resolution of the Debt Ceiling in US, upside pressure increased at the start of 2013. Prices managed to push above the rising wedge this week, heading above 9.07. This appears to be the onset of a bullish breakout for USD/ZAR, and Stochastic readings suggest more space for current rally to continue before entering into a technical Overbought region.
Hourly Chart
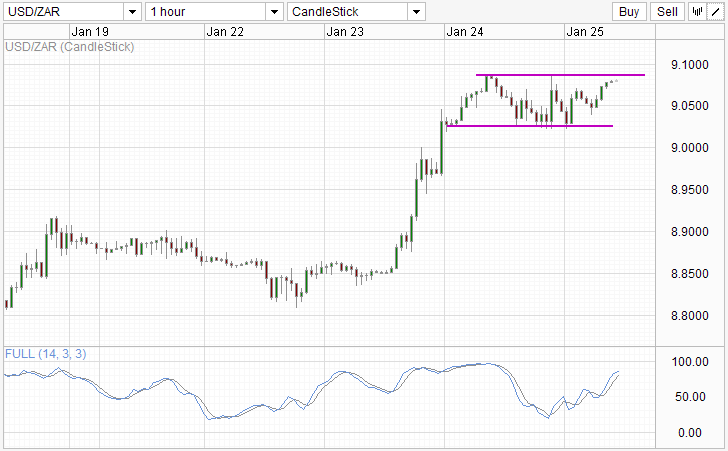
Hourly Chart also suggest the same, with any rally breaking away from here resulting in a short-term bullish breakout as well. Similarly, Stochastic is also some distance away from the previous peak, though the legroom is lesser than what we see via the weekly chart. Perhaps we could still see a shorter-term pullback from the top of the consolidation channel before a longer-term bullish breakout, which would still satisfy the Weekly Chart breakout scenario provided price does not breach below the rising wedge.
This article is for general information purposes only. It is not investment advice or a solution to buy or sell securities. Opinions are the authors; not necessarily that of OANDA Corporation or any of its affiliates, subsidiaries, officers or directors. Leveraged trading is high risk and not suitable for all. You could lose all of your deposited funds.
Latest posts by marketpulsefxstaff (see all)
- Oil Remains Near Multi-Month Lows - 6 August 2015
- U.S. Dollar Higher on Recent Data - 6 August 2015
- Greece’s PM Tsipras: Loan Deal with Lenders Close - 6 August 2015