New Zealand published its largest Dec Month trade surplus since 1991. This appears to be good news prima facie, but when we read the fine prints, it turned out that exports has fallen, while imports has fallen even harder resulting in this record.
Seasonally adjusted figures show Exports falling 5.3% to $4.1 million Y/Y, primarily led by a fall in crude oil prices. Imports fell by 10% Y/Y to $3.6 billion. Trade surplus stood at $486 million in Dec 2012, about 10 times the average of $49 million for December in the previous 5 years.
Few notable developments in exports behavior (Y/Y):
Australia – Largest Decrease $182 million (19%) due to lower crude oil prices
China – Largest Increase up $182 million (34%) due to food products
United States – 2nd largest Increase up $53 million (15%) due to food products
Few notable developments in imports behavior (Y/Y):
Singapore and Saudi Arabia – Down 53% and 55% respectively due to lower crude oil prices
France – Down $175 million (68%) due to lower aircraft imports
Thailand – up $49 million (68%) due to automobiles
All in all, it seems that a large contributor to the change in trade balance is due to changes in crude oil prices which varies from the country of origin. If we take that out of the equation, we are left with lower aircraft imports from France, which is certainly not a good representation of local New Zealand demand and consumer purchasing behaviors. The headline import and export figures were causes of concern, but reading the fine print does not allow one to draw the same bearish conclusion. If anything, NZD/USD bulls will be glad to see exports to China and America are increasing, while increasing automobile imports can be interpreted as a sign that consumers are willing to spend more on higher commitment items and/or companies are willing to spend more on transportation.
2 Hourly Chart
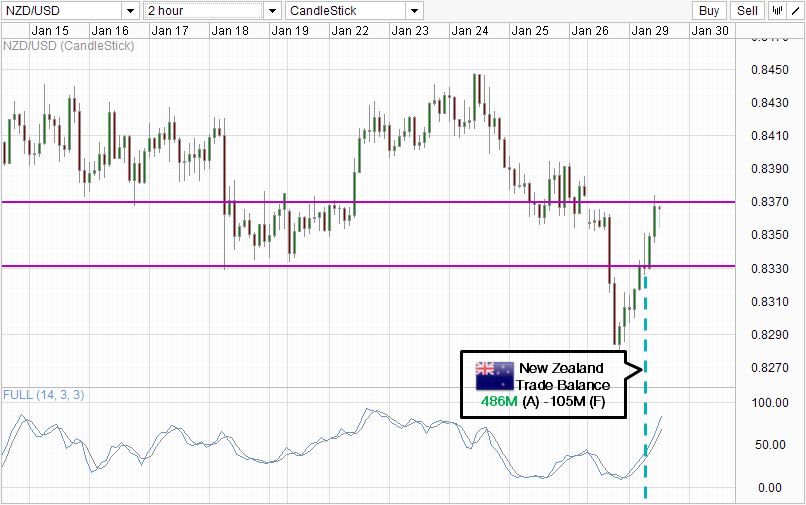
Price rally following the export news, but some perspective must be given as Asian trade was bullish with Nikkei 225 and ASX both rising in a “Risk On” environment. AUD/USD was also rallying (though it has its own reason for rally), pulling its Oceanic counterpart along.
Currently price has entered into the 0.833 – 0.837 consolidation range found between Jan 18 – 22nd. A break higher will open up 0.837 – 0.845 range, with 0.841 potentially acting as resistance in the interim.
Daily Chart
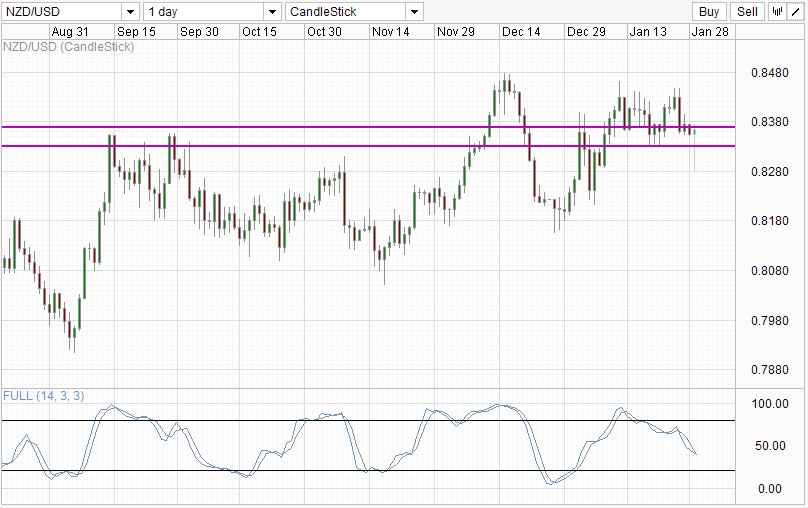
NZD/USD looks heavy via Daily, but the hammer candlestick that is forming post Trade Balance news release will be a concern for bears. Stochastic suggest that we can still have some selling lower before hitting “oversold”, but the Stoch and the Signal line looks to be crossing/crossed, which provides bias to the upside. This does not mean that Bulls will have their field day, as we’re looking at RBNZ’s rate decision later this week. With NZ Prime Minister Key saying today that high NZD is hurting exporters, expect more speculators preparing to sell into rallies to play the possibility of RBNZ rate cut this Thursday.
Click here for the full Statistics
This article is for general information purposes only. It is not investment advice or a solution to buy or sell securities. Opinions are the authors; not necessarily that of OANDA Corporation or any of its affiliates, subsidiaries, officers or directors. Leveraged trading is high risk and not suitable for all. You could lose all of your deposited funds.
Latest posts by marketpulsefxstaff (see all)
- Oil Remains Near Multi-Month Lows - 6 August 2015
- U.S. Dollar Higher on Recent Data - 6 August 2015
- Greece’s PM Tsipras: Loan Deal with Lenders Close - 6 August 2015